Welcome back to my economy study journey! Today, we explore one of the most powerful tools in economics: the Yield Curve.
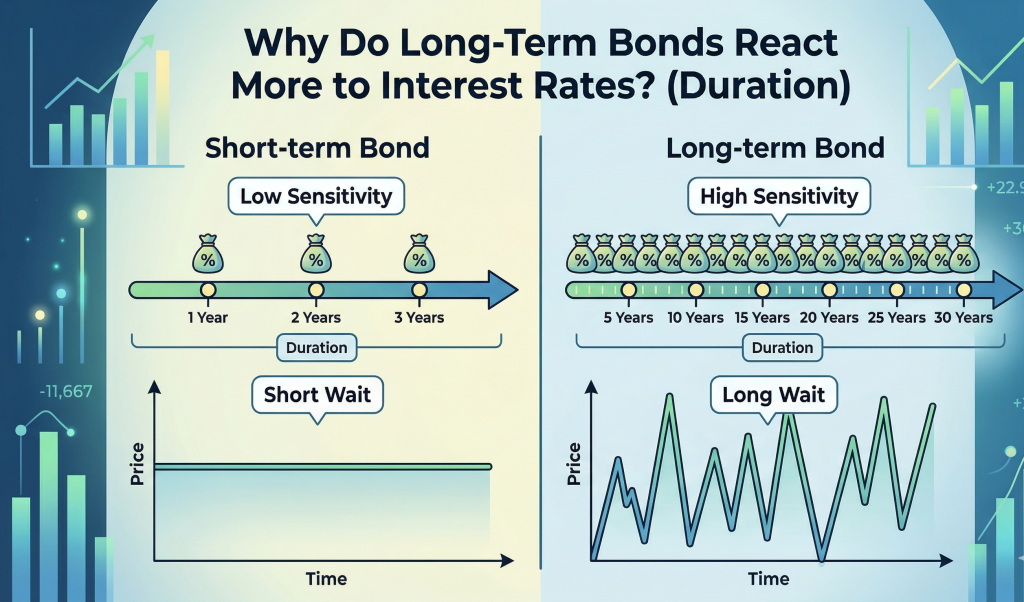
In Day 2, we learned how “Bond Duration” explains why long-term bonds move more dramatically than short-term bonds. But as I continued studying, a new question came up:
“What happens when we look at short-term and long-term interest rates together?”
Surprisingly, the relationship between the two doesn’t just describe bonds—it tells a story about the entire economy. Today, I’m unpacking that story.
1. The Big Picture: The Market’s Storyline
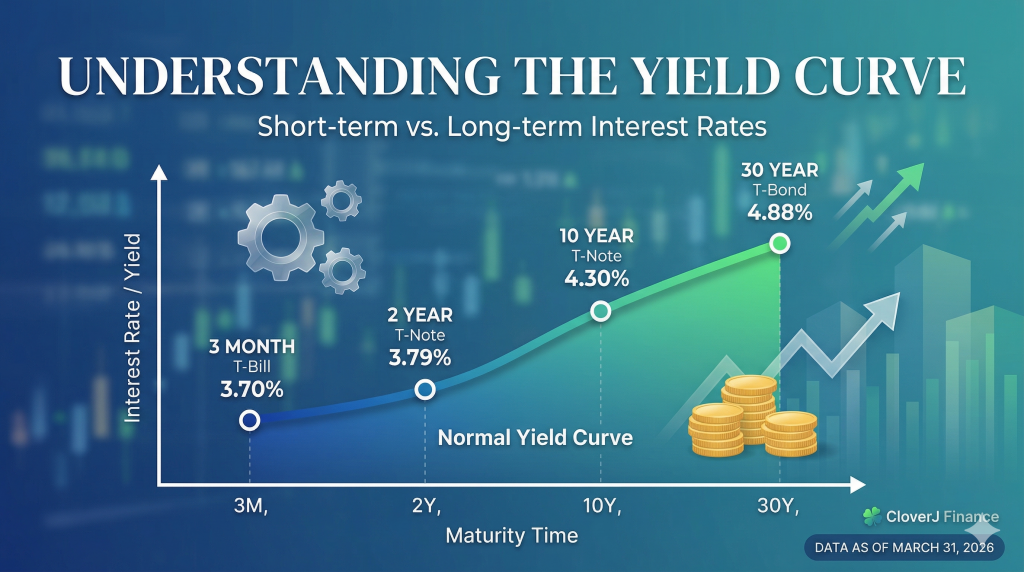
The Yield Curve is simply a graph that shows interest rates across different time horizons.
- Short-term rates (1–2 years): What is happening now.
- Long-term rates (10–30 years): What the market believes will happen.
When you connect them, you get a curve. But this isn’t just a line. It is the market’s collective expectation of the future. The gap between these rates is where the real story lives.
2. The Core Concept: Present vs. Future
The Yield Curve is essentially a comparison between:
- The Present (Controlled by central banks) vs. The Future (Priced by the market)
This comparison creates four possible patterns. Each one tells a completely different story.
3. The Four Yield Curve Patterns
- 🟢 ① Normal Curve — A Healthy Economy
- Long-term rates > Short-term rates
- The further into the future you go, the more uncertainty there is. Investors demand higher returns for taking that risk.
- 👉 The Message: “The economy is stable, and the future looks reasonably good.”
- 🟡 ② Steep Curve — A Recovery Phase
- Long-term rates are much higher than short-term rates. This happens when the economy is coming out of a slowdown and the market expects strong growth ahead.
- 👉 The Message: “Things aren’t great now, but they will get much better.”
- 🟠 ③ Flat Curve — Uncertainty
- Short-term and long-term rates are almost the same. The market is essentially saying it’s at a turning point or growth is slowing.
- 👉 The Message: “We’re not sure what comes next.”
- 🔴 ④ Inverted Curve — Warning Signal
- Short-term rates > Long-term rates
- This happens when the market believes the economy will slow down so much that central banks will be forced to cut rates in the future. Historically, this often appears before a recession.
- 👉 The Message: “The future will be weaker than the present.”
4. A Simple Way to Read the Curve
Instead of memorizing patterns, I found a simpler way to think about it:
- Short-term rates = The Central Bank’s voice
- Long-term rates = The Market’s opinion
When they disagree, that’s when things get interesting. For example, if the Central Bank is raising rates (short-term up) but the market is worried about a crash and buying safe-haven bonds (long-term down), the curve inverts.
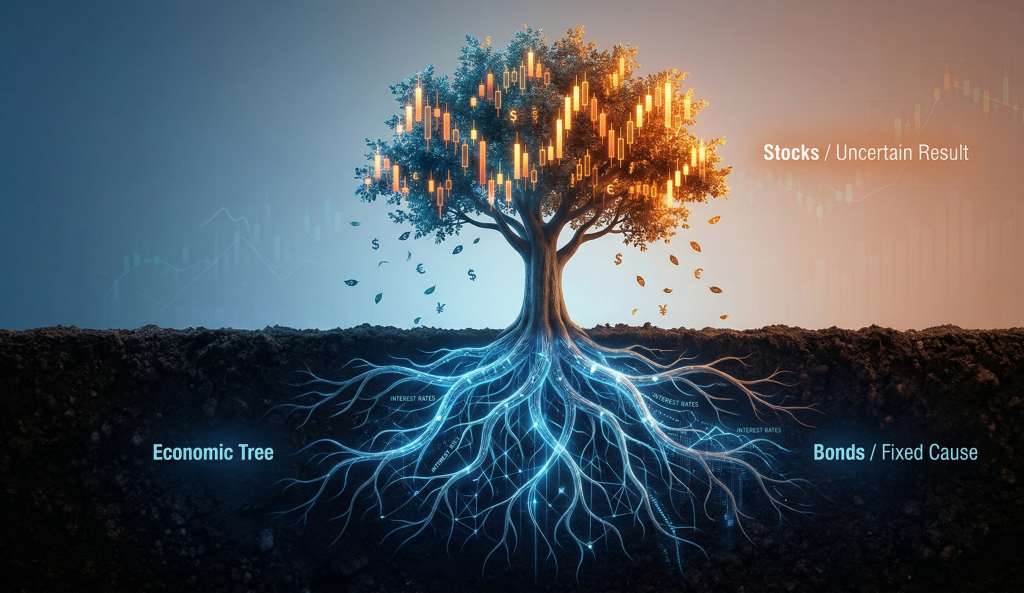
5. Why This Matters
The Yield Curve isn’t just about bonds. It connects to everything: Stocks, Housing, Currency, and Economic Cycles. It’s one of the few tools where you can see the future expectations of millions of investors in a single line.
6. [Real-Time Analysis] What does the US Yield Curve look like today?
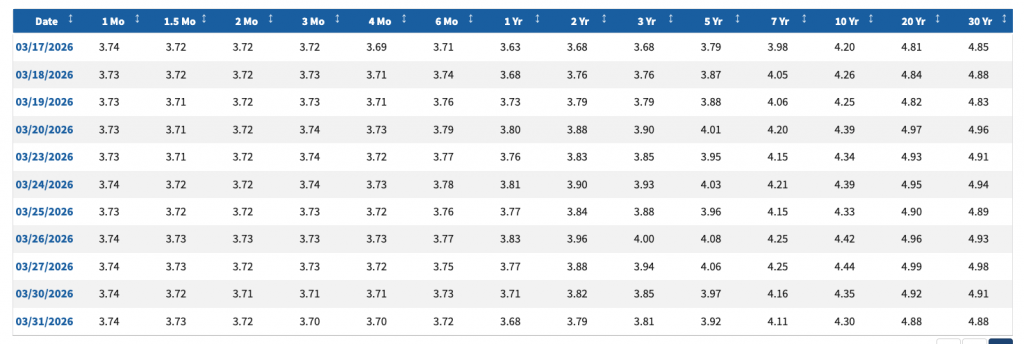
Now that we’ve learned the theory, let’s look at the actual market. As of today (March 31, 2026), here are the key US Treasury yields:
🔍 Data Analysis: CloverJ’s Interpretation
Applying the patterns I learned to today’s data reveals some interesting insights:
- Normal Curve Shape: The 10-year yield (4.30%) is higher than the 2-year yield (3.79%). We are currently in a ‘🟢 ① Normal Curve’ phase! The market is properly pricing in the “time premium” for the future.
- Healthy Spread: The gap between the 10-year and 2-year yields is about 0.51%p. This indicates that the market expects moderate economic growth rather than a sharp recession.
- Market Sentiment: While the central bank is holding short-term rates around 3.6%, investors believe the economy will remain active enough in the long run to sustain higher yields.
CloverJ’s Personal Take: Listening to the Curve
Today, I realized something important. The Yield Curve isn’t predicting the future perfectly, but it shows what people with “real money” are betting on.
Anyone can have an opinion about the economy. But the Yield Curve shows where money is actually flowing. From now on, instead of just watching the news, I want to watch the curve. The curve doesn’t talk—it reflects.
What’s Next? (Day 4 Teaser) We’ve learned the price of money (rates), the risk of time (Duration), and the relationship between present and future (Yield Curve). But where does money actually flow? In Day 4, we’ll connect interest rates, currency (Forex), and capital flow. Stay tuned!